KPIs for everyone, at a cost that drops with every user.
SensoDATA is a Power BI portal with your brand, connected directly to the ERP. The whole company sees the right numbers, and every user from the 6th on costs up to 90% less than a Power BI Pro license.
You need SensoDATA if…
0 of 4
Browser access, with your company's identity.
Sales, production, costs, materials and finance, plus custom dashboards.
Profiles by company and department, two-factor authentication, audit trail and read-only connection.
Automatic refresh and numbers that match the system.
From the 6th user on, the price drops by tier as your team grows.
Support for FSC® certification with the same care for data.
Learn more about FSC Control
A dashboard for every department.
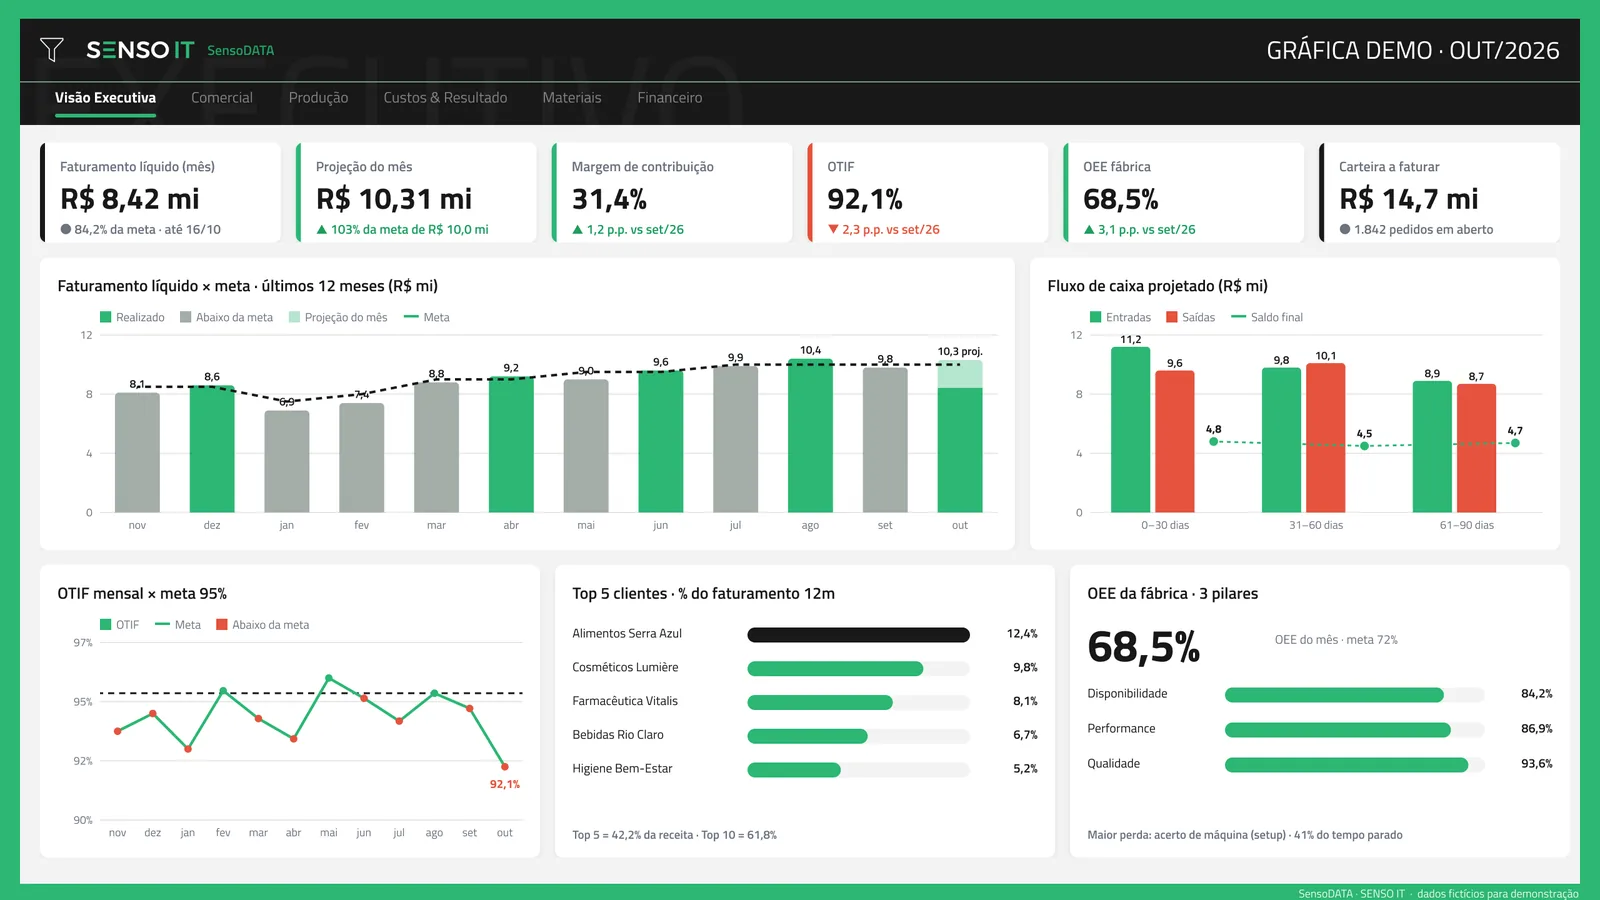
- Revenue vs. target with month-end projection
- Margin, OTIF and OEE in one place
- Backlog to invoice
Executive view
- Revenue vs. target with month-end projection
- Margin, OTIF and OEE in one place
- Backlog to invoice
Sales
- Sales by segment, customer and sales rep vs. target
- Quote conversion and loss reasons
- Funnel from quote to work order
Production
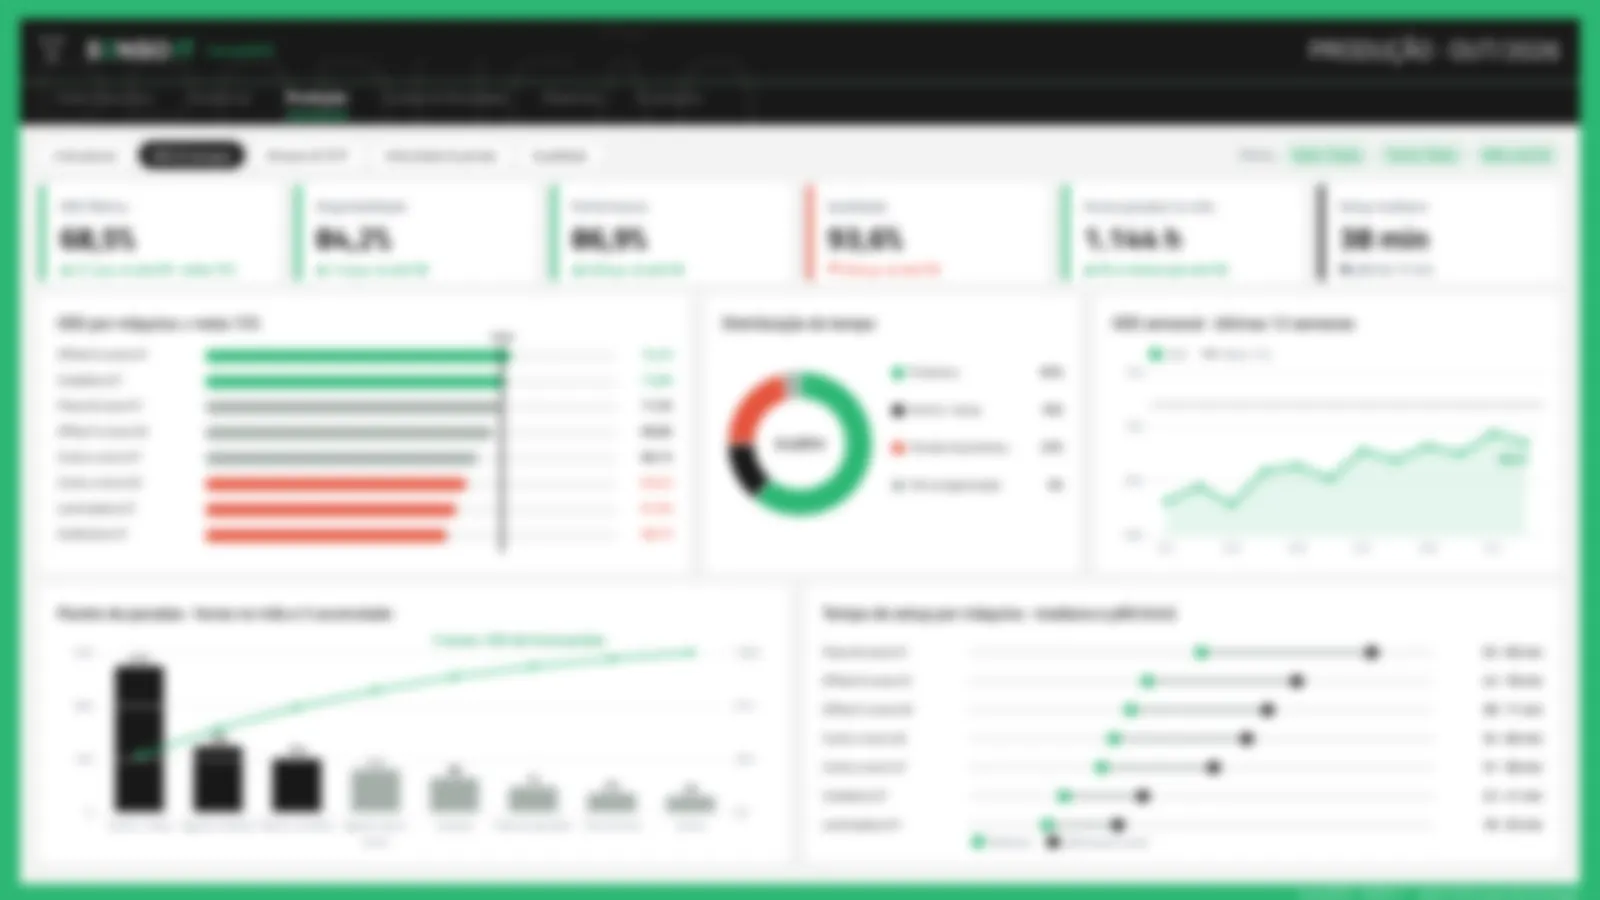
- OEE by machine and main stoppages
- Make-ready (setup) time
- Late work orders and OTIF
Costs and results
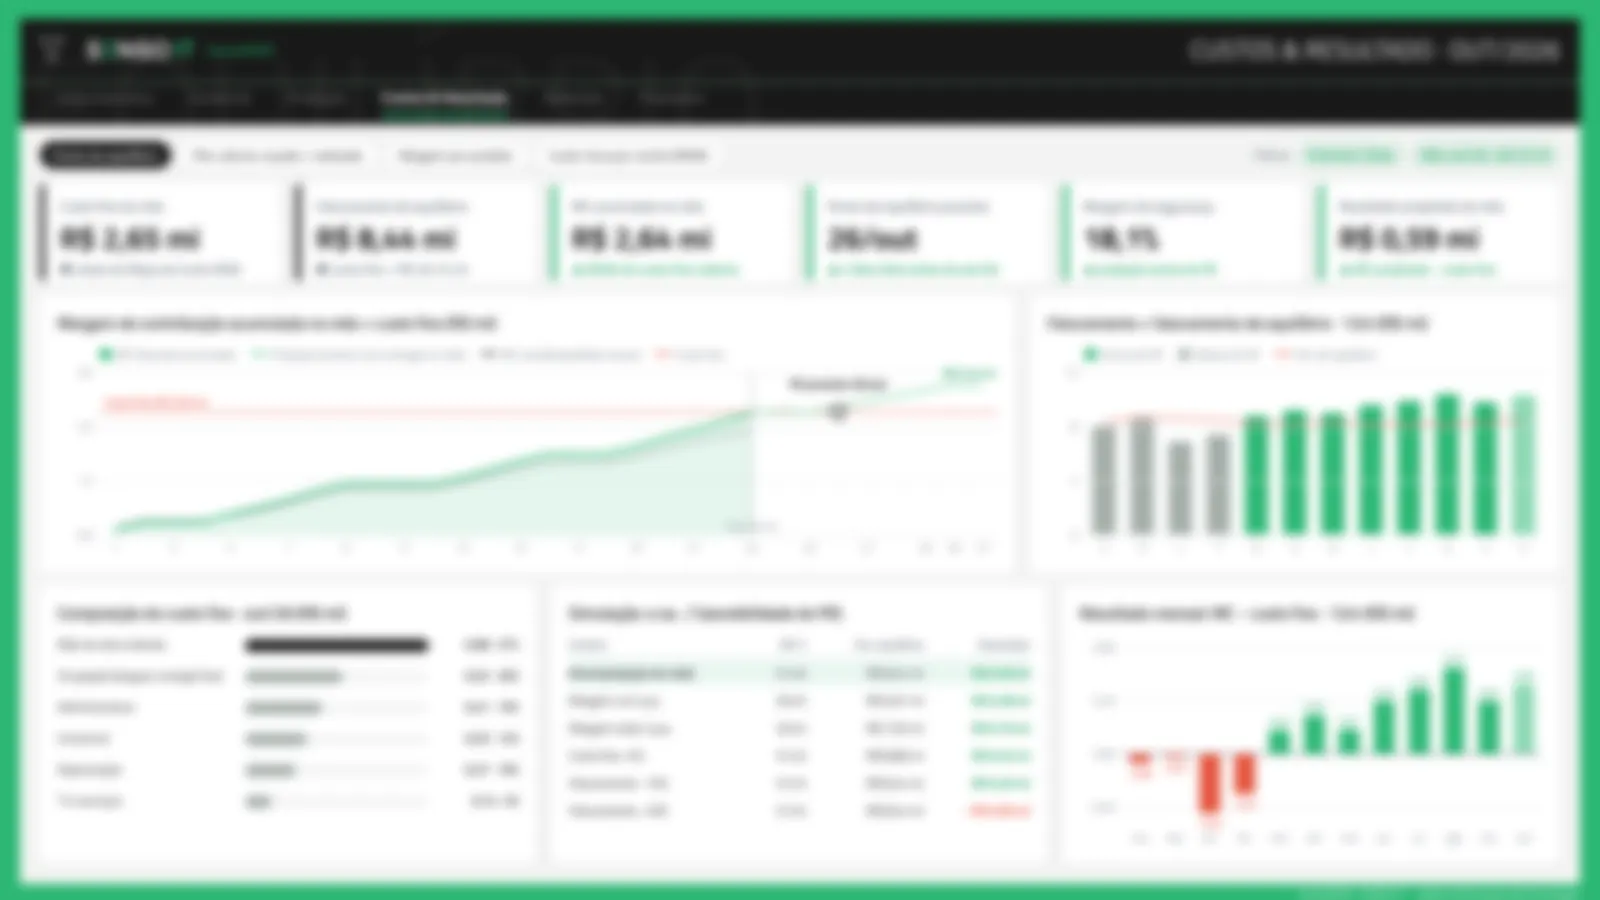
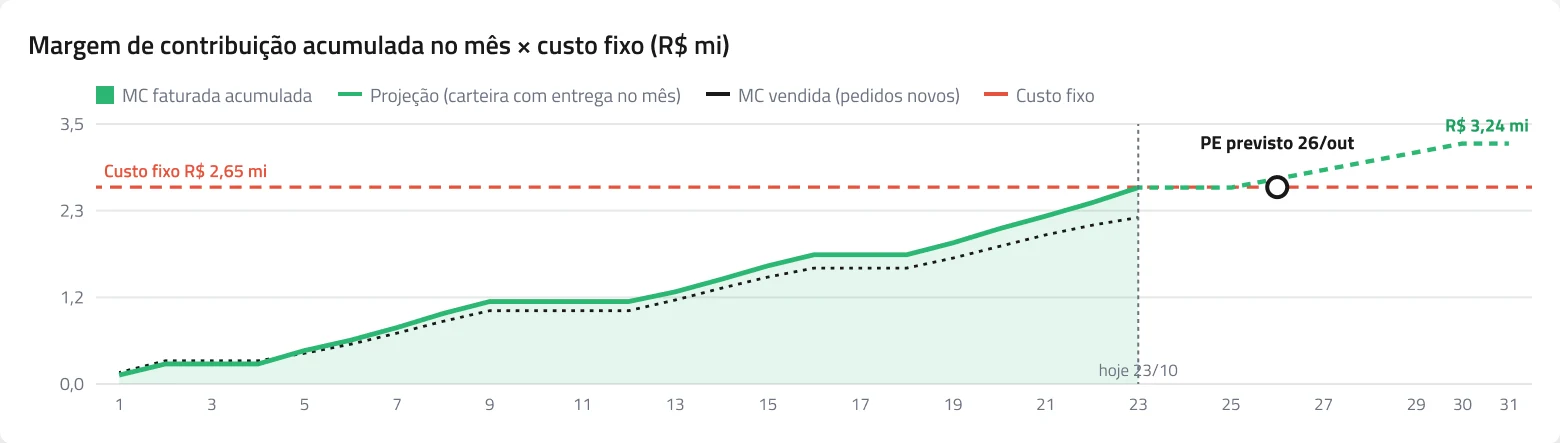
- Monthly break-even point
- Margin by product
- Quoted vs. actual
Materials
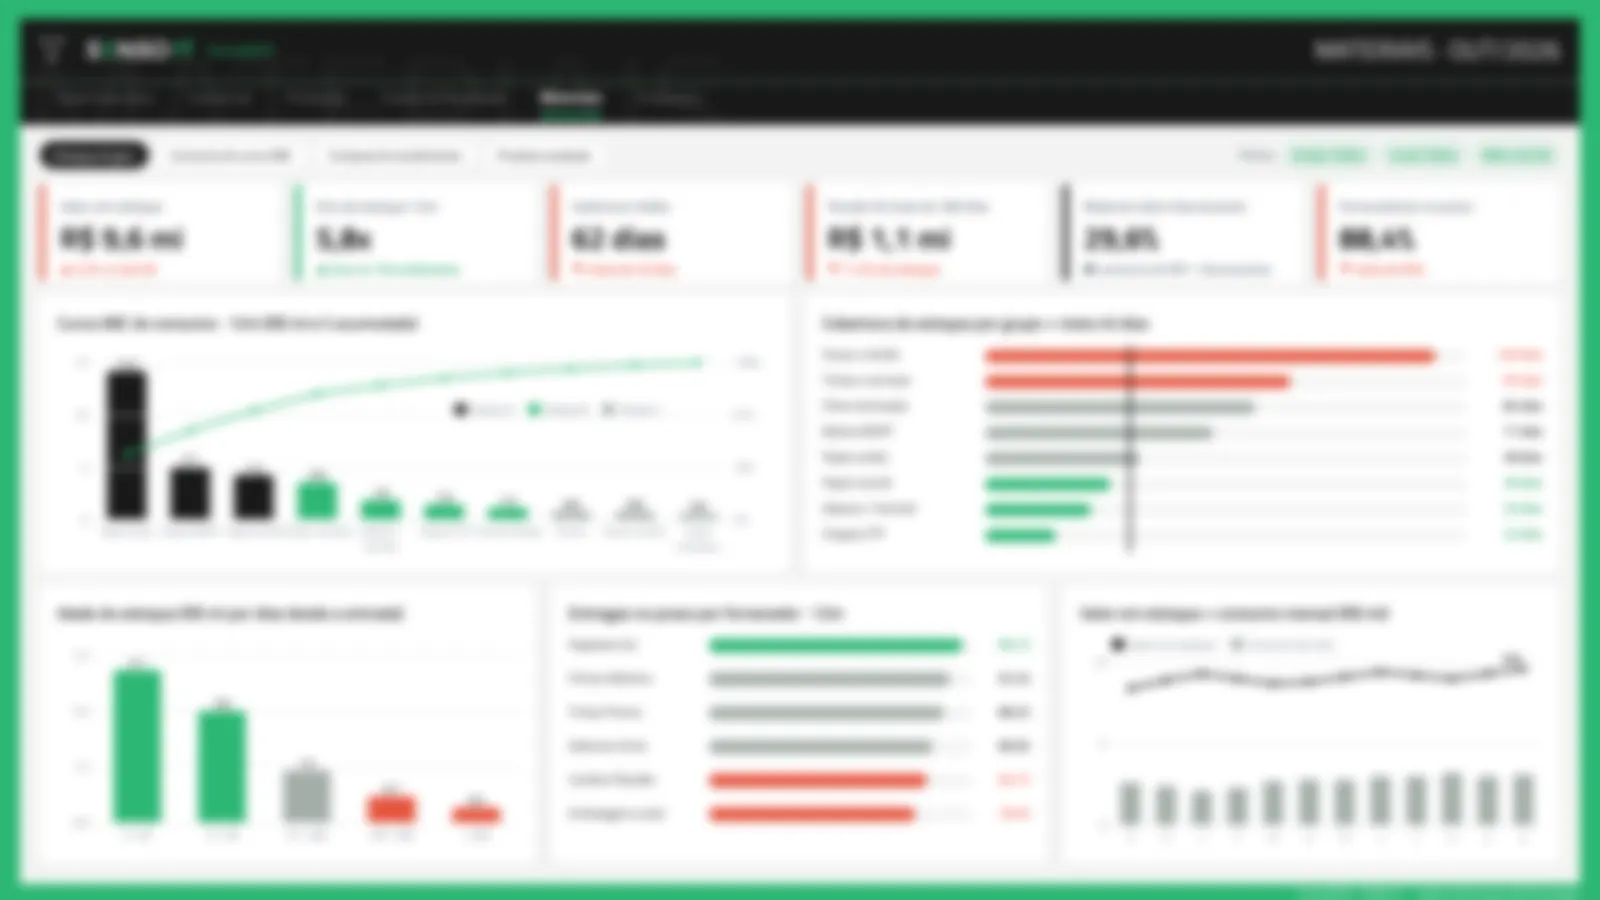
- ABC curve and inventory turnover
- Supplier on-time delivery and pricing
- Idle finished goods
Finance
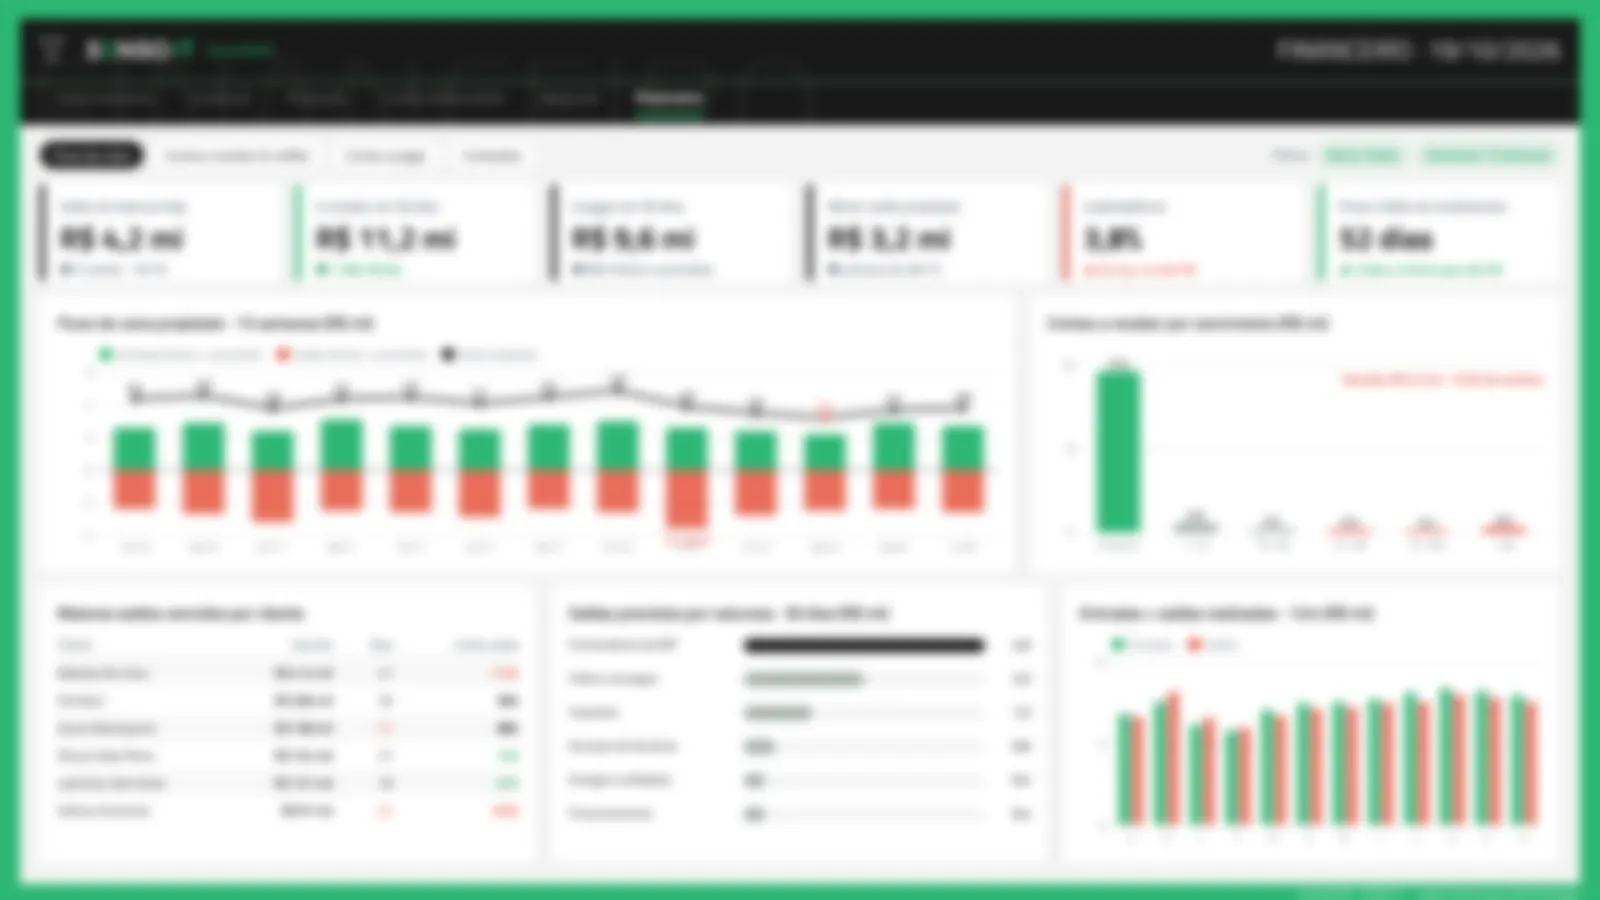
- 13-week cash flow
- Accounts receivable vs. credit
- Accounts payable and cash conversion cycle
Examples with sample data. Your company's dashboards are defined during implementation.
What changes in practice
- Reports built by hand
- BI for a few because of licensing
- Each department with its own number
Know which day of the month your company starts making a profit.
Cumulative margin against fixed costs, with the backlog projection: by mid-month, leadership can see whether the month will close in the black.
How the savings happen
Monthly portal fee with 5 users included. From the 6th on, each user costs less, by tier — up to 90% below a Power BI Pro license.
Illustrative. Prices in the proposal.
- Ready for Metrics ERP
- Web portal with your brand
- Support from our team
From the ERP to the portal, in five steps.
Call and KPI definition
Secure connection to the ERP
Portal live with your brand
Every number validated with your team
Training and ongoing support
Frequently asked questions.
Keep exploring.
Shall we talk about your operation?
Tell us the challenge. We reply within 1 business day to schedule the best time.